Field boundary mapping
Draw your field on a satellite map. Area is calculated geodesically and every field gets its own record.
Vyom Engine turns Sentinel imagery into field-level crop health maps, 30+ vegetation indices, time series and alerts, for farmers, FPOs and businesses.
 Powered by Copernicus data
Drag to rotate Earth, scroll or pinch to zoom, and tap a satellite to see what it sees.
From drawing your first field to integrating satellite data into your own product, one platform covers every stage.
Draw your field on a satellite map. Area is calculated geodesically and every field gets its own record.
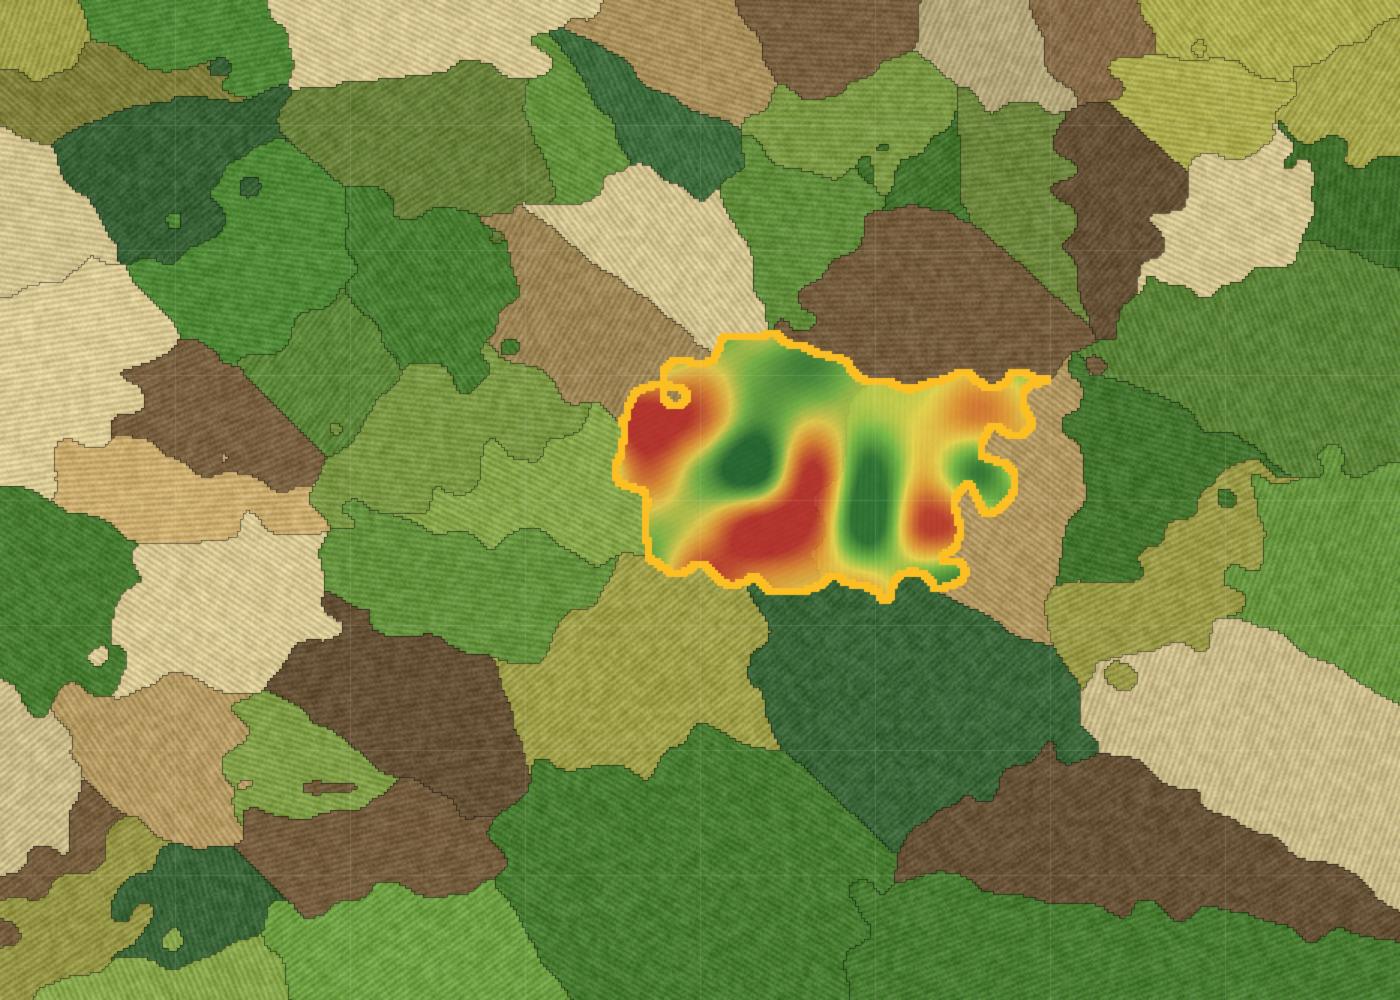
NDVI and 30+ indices at 10 m pixels, shown as clear colour maps with Low / Medium / High scales.
Up to 365 days of history from day one, then a fresh reading every few days.
Sentinel-1 SAR keeps working under monsoon cloud, with RVI and VV/VH signals.
Moisture indices plus clearly labelled gap-filled estimates when clouds block a pass.
Spot waterlogging, residue burning and harvest from before / during / after maps.
Create farms, query indices, dates and time series, with API keys and a live playground.
Satellite values are interpreted with crop stage, weather and soil into simple field-specific guidance.
See every field in one place and find the ones that need attention first.
From the AgriDoot farmer network to every pixel on the map.
Each satellite answers a different question. Together they keep your monitoring continuous, even under monsoon cloud.
"What does the crop look like?"
"What is happening physically?"
"What is the wider region doing?"
Drag the handle: left is true colour, right is the selected index. Hover or touch for values. Illustrative sample field.
Grouped by the agricultural question each one answers.
NDVI · EVI · EVI2 · SAVI · MSAVI2 · OSAVI
Greenness, establishment and crop vigour
NDRE · NDRE_B7 · NDREX · ARI1 · CAR_RE
Chlorophyll condition and stress signals
LAI proxy · NIRv · RVI
Canopy development and biomass
NDMI · NDWI · MSI · RSM
Moisture condition and water stress
SOC proxy · BSI
Soil variability and bare soil
MNDWI · AWEI_SH · AWEI_NSH · WI2015
Water and flooding conditions
NBR · NBR2 · BAI
Burn scars and damage assessment
Vyom GIS quantifies what is happening in the field. Gyan AI interprets it in an agricultural context.
From "What is happening in my field?" to "Where should I act?"
Tailored intelligence for each role across the agricultural value chain.
Pick a plan for your fields, or get an API account for your product. All prices exclude 18% GST.
About Rs. 28 per acre per month
About Rs. 26 per acre per month
About Rs. 25 per acre per month
Flat annual fee, not tied to farm count
Invoiced monthly in arrears, 15 days to pay
Estimates only. 18% GST is added at checkout. Coupon codes can reduce the total.
The most common questions from farmers, FPOs and businesses.
Open the dashboard, choose Add New Field, search for your area and click points to trace the boundary. Vyom Engine then fetches up to a year of satellite history for it.
The first full backfill takes up to 12 to 18 hours. A progress overlay shows until it is ready, and if a neighbouring field already covered the same area it can appear almost instantly.
Every field is checked about every 6 hours, and new readings appear as soon as a usable Sentinel pass is processed. Sentinel-2 revisits roughly every 5 days and Sentinel-1 every 6 to 12 days.
Yes. Sentinel-1 radar sees through clouds, and every reading is labelled satellite, interpolated or provisional, so a gap-filled estimate is never passed off as a real pass.
No. Vyom Engine runs in any modern browser on phone, tablet or desktop, and AgriDoot also has Android and iOS apps. You can sign in with Google or just a phone number and OTP.
Yes, from the field page. Deletion is permanent and removes its history, so double-check before confirming.
Today it processes Copernicus Sentinel-2 (optical) and Sentinel-1 (radar). Sentinel-3 is on our roadmap for broad-area context such as land surface temperature and daily regional trends.
NDVI is the Normalized Difference Vegetation Index, a standard measure of plant greenness. Vyom Engine offers 31 Sentinel-2 indices and 2 Sentinel-1 indices, grouped by the question each one answers.
Interpolated values sit between two real readings. Provisional values carry the last real reading forward until a new one arrives. Treat both as estimates and prefer a real satellite reading when one exists.
Usually cloud cover blocked the optical sensor for that pass. Check the Sentinel-1 indices, or move to a nearby date.
New fields fetch up to one year of history automatically, with imagery up to 85% cloud cover so you get as many real readings as possible.
Not yet. True radar-based soil moisture needs a dedicated retrieval algorithm that is not implemented. Optical moisture indices such as NDMI and NDWI are available.
Individual field plans are priced per acre: Rs. 85 for 3 months, Rs. 155 for 6 months and Rs. 295 for 12 months, plus 18% GST. Each plan includes all satellite indices, weather, expanded Gyan AI access and field advisory.
The field shows Recharge to continue and stops refreshing. Pick a new plan to unlock its map, indices and trends again. Your other fields are not affected.
Pay online through Razorpay. A GST invoice is emailed as a PDF after every successful payment and is available in the Billing page.
Yes. Enter the code wherever you see Coupon code (optional) and the price breakdown updates immediately.
An API key and secret, endpoints to create farms and fetch indices, dates, time series and map layers, full API docs and a live playground. It costs Rs. 999 per year, plus Rs. 55 per acre per year for farms you create through the API.
Per acre, per year, invoiced monthly in arrears with a 15-day window to pay. All amounts carry 18% GST and a GST invoice is issued.
Open the API page in the dashboard and follow three steps: verify your company GSTIN, verify a business email address, then pay the annual fee.
Yes, the partner API allows 60 requests per minute per key by default. Contact us if you need more for a large portfolio.
Yes. Teams use field-level time series and event maps for crop-condition monitoring, claims evidence, portfolio tracking and programme assessment. Contact us for volume or custom needs.
Tell us about your operation and we will point you to the right plan, a walkthrough or a Business Account.